Introduction
This is a tutorial on how to use SumPi to extract summary piles from sorting task data.
To illustrate the model, I will use the data from the categorization of food items (task 36) from our sorting datasets in Behavior Research Methods. You can recreate the results on your own,
but if you want to have the exact same files they are available here:
1. The data file: sorts of 40 food items using the multiple cards sorting task obtained from cardsorting.net. [CSV].
2. The main results file. This output file is used to determine model determine the number of summary piles, and check fit and accuracy of the model. [xlsx].
3. The detailed output file for the 11 summary piles solution. This output file is used to analyze the results. [xlsx].
When you are ready, start SumPi.
Many tips will appear here!

This tutorial is "print ready". To print, press CTRL-P on your windows computer.

 dataset   indicates that we give you details relating to the food items dataset.
Loading the data
The files that the software uses are built following the format from cardsorting.net. The first row must contain titles for the columns. Input files must contain:
1. Unique identifier for each participant (cardsorting.net: Uniqid)
2. Pile label (cardsorting:net)
3. Participant start date and time (cardsorting.net: Starttime)
4. Participant end date and time (cardsorting.net: Endtime)
5. Participant external identifier (cardsorting.net: QID)
After that, each column represents a card. Columns presented after (e.g., comment in cardsorting.net) are ignored. Importantly, each row after the first row represents a pile. A participant who made 5 piles thus has 5 rows. If an item is in a pile, 1 is entered, 0 otherwise.
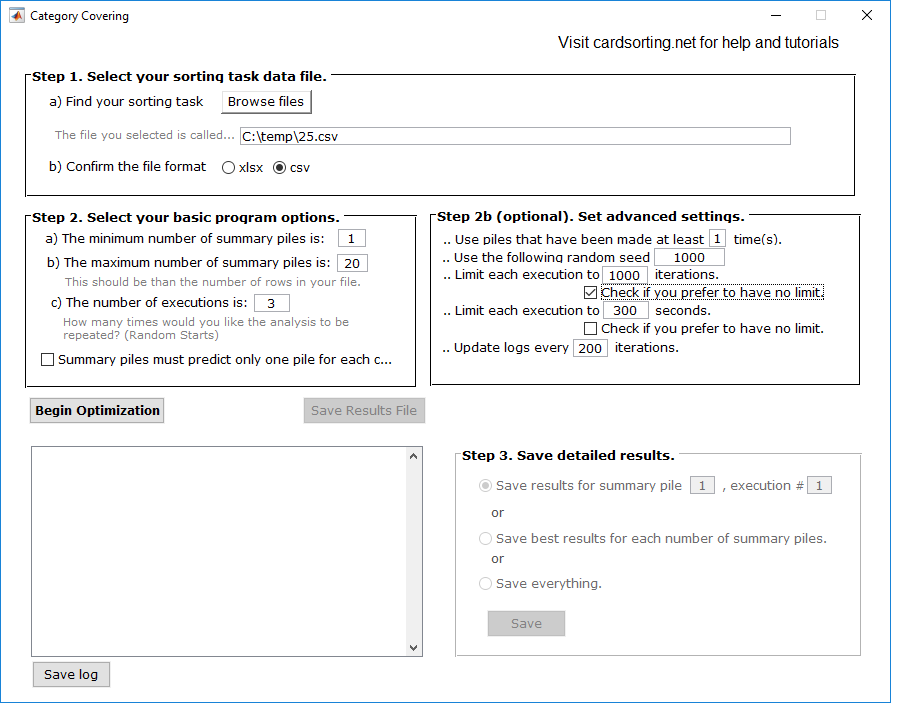
dataset. In the sample file, there's 40 food items going from "carrots" to "yogurt". For the participant 2249 (first row), a pile called "sides" was made with bread, onions, potatoes, and rice. At this point, the interface should look like this:

Tips:

If you downloaded the csv file from cardsorting.net, you just need to load it via the interface!

Don't forget to indicate if the file is CSV or Excel.

The software automatically determines the piles from zero and ones, and the number of cards too.

If some of the columns don't have data in them (e.g., qid column, the comments column), that's okay.
Program Options
There are many options available as part of the software. Setting it properly is quite important, and both basic and optinal program options should be looked at.
In the basic program options, you have to indicate the minimum and maximum number of summary piles for the solutions to look at. For example, running from 1 summary pile all the way to 20.
Basic program options
In the (poorly named) advanced program options, you indicate the basic settings of the algorithm itself. This relates to convergence, and computational times.
Advanced settings
dataset. The interface should now look like this:
How much time? How to choose?

1. To calculate the number of models that will be run, use the formula (b-a+1)*c.

For example if you indicated a minimum of 1 summary pile (a), a maximum of 20 summary piles (b) and 3 executions (c), the software will run (20-1+1)*3=60 models.

2. Regarding d), the consequence of checking this box is that the minimum number of summary piles (in a) must be at least as large as the number of piles from the individual who made the most piles. This model is not discussed in the paper, and is not currently recommended.

For example the consumer who made the most piles made 15 piles, the value in a) (minimum number of summary piles) must be 15 or greater.

3. There is no hard and rule on what is the maximum number of summary piles to run. Typically, I start with a value of 20 or so and if I see that improvements are still significant from 18... 19... 20, I will increase the maximum by another 5 or so. Sorting datasets where huge amounts of heterogeneity are present typically require a greater number of summary piles.
Running the model
At this point, you should be all set to start. It is good practice to check if the options you set will be "reasonable" in terms of time. To do that, use the following formula: (b-a+1)*c*max time.
For example if you indicated a minimum of 1 summary pile (a), a maximum of 20 summary piles (b) and 3 executions (c), and a maximum computational time of 300 seconds, the software will run (20-1+1)*3*300=18000 seconds, or 5 hours.
When you are ready, press "Begin optimization"! The estimated time left will give you the amount of time remaining for the completion of all runs.
Tips:

1. If you don't have a good idea of how many summary piles you need, you can reduce some of the numbers to get "a sense" of the data.

For instance, you could run the model with c=1 (1 execution) and 180 seconds for max time. Doing so would reduce the total time to 60 minutes.

2. As discussed below, it's important to give the model sufficient computational time. We will discuss then how to check whether you gave it sufficient time and whether you can be confident in your solution.

3. If you decide to cancel the runs, press the "X" on the top right of the window. Careful, doing so will not let you save any results!
Checking the solution
All the runs are completed, that's good. Before you can decide the number of summary piles, there's still a few things you have to check.
1. Check that all the data was loaded properly. Go to the "Summary" tab of the excel file and verify the numbers. If the number of individuals correct? Does the number of piles correspond to the number of rows (minus the header) in the input file? Is the number of objects correct?
2. Look for non-convergence via "negative improvements" in fit. Models like our are subject to optimization problems (i.e., local optima). To check that all is kosher:
a. Click the save the results file button. You will be prompted for a filename and folder. After a few seconds, you'll get the message "Saving... done." Open the file in Excel.
b. In the file go to the tab that says "Selection of # of Summary Piles".
c. If you find any negative improvement in the "improvement percentage" column, you got problems. It means that a solution with more summary piles performed worse than a solution with fewer. See tips for strategies to resolve this.
dataset. Although your numbers might be different it should look fairly similar to this:

3. Look for huge variations between executions, for a given number of summary piles. If you ran the model with more than one execution (as recommended), you can see if the solution is found many times. That would be a good sign. If you find huge differents, see the tips to the right.
Tips:

If you find negative improvements or huge variations between executions, try to increase the number of executions and increase the amount of computational time. And then, unfortunately, you have to rerun.
Selecting the number of summary piles
Choosing the number of summary piles for your data is something of an art. In data reduction models (like this one) one looks to see when the addition of one more summary pile does not improve the fit much. In this case, when does the addition of one more summary pile change very little? Remain on the "Selection of the Number of Summary piles" sheet. Look at the improvement percentages and look for points after which there's a big decrease in improvements.
a. Model fit: how well the model does, for a given number of summary piles, at predicting the original data.
b. Interpretation: Try to label the piles. Can you easily name them? Is every card assigned to a pile?
dataset. Looking at the following chart (just a line chart in excel):

I would be tempted to select either 8 or 11 summary piles. How to choose between the two? I would turn to a) fit and b) interpretation.
The original data size is (# of piles * # of objects/cards). In this case, that's 240*40=9600. From the min column (indicating the best execution), the model with 8 summary piles produces 520 mispredictions out of 9600, for an error rate of only 5.42%. The model with 11 summary piles produces 421 out of 960 for an error rate of 4.39%. Both predict very well.
For the 8 summary piles solution, I could easily name the piles (pizza, protein, drinks, dairies, grains, snacks, fruits and vegetables). Yet several items weren't in any pile. This included cake, doughnut, egg, and spagetti.
For the 11 summary piles solution, the labels were also easy to assign (fruits & vegetables, fruits, protein, fish, vegetables, drinks, dairy, grains, snacks, pizza, desert). Only two items were not in a summary pile: egg, and spagetthi. How it can be labeled is presented in the following figure.

Based on what I see here, I would go with the 11 summary piles solution.
First it provides a very good fit: by using only 11 piles instead of 240 made in total, we still predict over 96% of the data.
Second it provides some hints at important nuances in how food items are assigned to piles. For instance whereas one summary pile (3% of pile made) group fruits and vegatables together, several involve fruits (6%) and vegetables (6%) separately assigned. It reflects both their similarity and their distinctiveness. The model also captures that fish are not only a source of protein but also quite distinct (salmon and lobster appearing in both). It also recognizes that individuals see some snacks as deserts (e.g., cookies) but not all deserts as snacks (e.g., doughnuts).
If that seems all good to you, now time to save the results! To do so, you have three options. Select a specific execution (look at the number in the spreadsheet), save the best for each number of summary piles (the min column) or save everything. Note that save everything takes time! For me, I'll just save the 11 summary piles execution 1 which produced the best fit.
Tips:

Scree plot: Choosing the point at which there is no more improvement can be quite challenging, but is common practice in data reduction models.

In doubt, investigate +/- 1 above/below and look for qualitative differences!
Detailed Analysis
In the detailed output file, there are five sheets:
- Summary
- Key matrices
- Data and predicted piles
- ID and summary piles
- Labels and summary piles
These five sheets help you fully understand the nature of your data, and each provide you numerous analyses and data you can use in your research.
1. Summary
The summary seems presents all the key information you will need to verify that the data was loaded correctly, records the seed number (for replication) and some basic statistics.
Verify again: is it the right number of participants? Is it the right number of objects? The right number of piles?
Calculate prediction accuracy: 1 - (# miscoverings / (piles made in the data X objects sorted)).
dataset. For my solution with 11 summary piles, accuracy is 1 - 421/(240*40) = 95.61%.
2. Key matrices
The key matrices tab includes two tables: 1) membership table and 2) accuracy table.
Membership table: This is the core table of the model, one that you should probably report in the paper. To do so however, you should label the piles.
To label the piles, look at which items are included & excluded in the each row and try to detect a pattern. In addition to the composition of the summary pile, we include two numbers: a) covering rate (percentage of total piles approximated by this one), and b) silhouette index (the average fit of each object to the summary pile).
dataset. Taking the first summary pile, we find a pile that approximates (or covers) 2.9166% (covering rate) of the 240 piles in the data. That is, this pile is used to predict 240*2.9166%=7 piles. It is also fairly consistent, with a silhouette average of 82%
Included objects: Carrots, Apple, Banana, Broccoli, Corn, Lettuce, Onions, Orange, Pineapple, Potatoes, Watermelon
Excluded objects: Bread, Butter, Cake, Cereal, Cheese, Chicken, Coffee, Cookies, Doughnuts, Egg, Hamburger, Lobster, Milk, Muffin, Nuts, Pancakes, Pie, Pizza, Popcorn, Potato chips, Pretzels, Rice, Salmon, Soda, Spaghetti, Steak, Waffle, Water, Watermelon
Based on this, I would be tempted to label the pile as raw fruits and vegetables. The included objects are all either fruits or vegetables, and none of the excluded items are fruits or vegetables in raw form. This one was pretty easy! The others could be labeled following a similar process. As stated above, I would label the other piles, in that order (percentage of all the piles covered by the summary pile): fruits (6.25%), protein (9.17%), fish (3.75%), vegetables (6.25%), drinks (12.08%), dairy (8.33%), grains (7.92%), snacks (7.08%), pizza (30%), desert (6.25%). Of course, we don't know how accurate these summary piles are at predicting, that's why we need the accuracy table.
Accuracy table: How well does the summary pile actually predict the piles that it is assigned to? Perhaps there's an object that is included and you thought, if your theory is right, that it shouldn't have been. Can you tell if it was a close call? The accuracy table helps you with that.
1. In bold, the table indicates the true positive rates. In other words, for the objects included in the summary pile, what percentage of the time does the real data agree with the summary pile that it should be included? e.g., a bolded number of .9: Across the piles assigned to this summary piles, which includes the object, 90% actually included object.
2. In regular font, the table indicates the true negative rates. In other words, for the objects excluded in the summary pile, what percentage of the time does the real data agree with the summary pile that it should be excluded? e.g., a regular font number of .9: Across the piles assigned to this summary piles, which excluded the object, 90% actually excluded object.
Numbers close to 50% indicate that it's a "toss up" as to whether the object should be included in the summary pile.
dataset. Taking again the first summary pile (now labeled fruits & vegetables), what can we learn?
Nuts: for 6 out of 7 (85.71%) of the data piles, excluding nuts from the fruits and vegetable summary pile was the right decision. That is, 1 out of 7 person included nuts in their pile closely resembling fruits and vegetables.
Onions: for 6 out of 7 (85.71%) of the data piles, including onions in the fruits and vegetable summary pile was the right decision.
Potatoes: for 4 out of 7 (57.14%) of the data piles, including potatoes in the fruits and vegetable summary pile was the right decision. That is, 3 out of 7 excluded potatoes. Perhaps thinking of them more like a processed/cooked side, it was more often excluded.
Rice: for 6 out of 7 (85.71%) of the data piles, excluding rice from the fruits and vegetable summary pile was the right decision. That is, 1 out of 7 person included rice in their pile closely resembling fruits and vegetables.
All the other items were predicted perfectly. Based on this, I'm not really questioning my interpretation. Some disagreement is bound to happen, although potatoes clearly stand out differently from the others.
Among the other summary piles, there were several interesting findings:
Protein: out of 22 piles associated with "protein", only 40.91% (1-.5909%) included egg. Further although lobster, hamburger and salmon were considered as part of the protein pile, there was substantial disagreement about it. Salmon and lobster were more strongly associated with fish.
Dairy: there was a fair amount of disagreement as to which of the food items are dairy. For instance, only 80% included butter, and 25% (incorrectly) included eggs.
3. Data and Predicted Piles
This sheet reproduces the original data but adds the predicted summary pile's number and a measure of consistency (silouhette index) in the last two columns. It can be useful if you try to see, intuitively, which individuals were assigned to which summary piles.
dataset. To illustrate, consider the first participant's six piles that he/she labeled: sides, meat, dinners, snacks, breakfasat, fruit and veggie, Drinks. The model predicted, in the same order: pizza (#10), protein (#3), pizza again (10#), snacks (#9), grains (#8), fruits & vegetables (#1) and drinks (#6).
The model (and our interpretation) did a perfect job for snacks, fruits and vegetables, meat (protein) and drinks. Grains are a good fit for breakfast, and the pizza prediction wasn't so good for sides or dinners. Win some, lose some.
4. ID and Summary Piles
This sheet produces a single file where each row is an, and each column is a summary pile. The data is 1 if the individual is predicted to have used the summary pile, 0 if not.
dataset. This data is particularly useful to look at correlations between pile usage. Replacing the pile numbers by our names, copy pasting in SPSS (or your favorite stats software), you can obtain a pairwise correlations matrix:

Looking at this correlation matrix, a few observations can be made.
1. Most participants separated fruits and vegetables, and if they did one, they always did the other (r=1.00). That said, some participants who did fruits and vegetables piles separately also did a produce pile (r=-.828 not -1) suggesting that they considered both levels of abstraction simultaneously.
2. The model predicted that everybody singled out the drinks.
3. Those who made a dairy pile were also very likely to make a grain pile (r=.516) and a snacks pile (r=.451). However, there wasn't a strong association between one's willigness to make a grain pile and a snack pile (r=.265).
4. Those who made a fruits pile were more likely to make a dessert pile (r=.467) and a vegetables pile (r=.467).
5. Labels and Summary Piles
If your original data included labels provided by participants, this sheet reproduces the labels and originizes them by summary pile. This can be particularly useful to check if your interpretation matches what is predicted by the model.
dataset. Looking at the labels for the food items:

Looking at this labels information, a few observations can be made.
1. Most piles were labeled quite well. Piles 1, 2, 4, 5, 6, 7, and 9 were nearly perfectly matching the labels provided by participants.
2. The pile previously labeled protein included labels for meat, protein, dinners. The most common one was meat so perhaps it could be an alternative label.
3. Many participants made a "breakfast" pile which combined some dairy and some grains.
4. The pile which we labeled "dessert" was seen by some as "dessert" and others "junk foods". It's really a matter of perspective!
5. The pile previously labeled "pizza" is not very well labeled as that labeled was never used. Rather, it seems the model only used this pile to approximate many piles that had few items but may have been very different. This included some fruits and veggies (inaccurately predicted), some breakfast, some bread, chicken, some treats, some fats, and butter alone. This suggest that perhaps a solution with more summary piles would have done better.
6. Some participants refused to label their piles and instead entered numbers (e.g., 1, 2, ... 10). This sometimes reflect a participant who did not understand the instructions, and it may help model fit to remove them.
Writing it up
Depending on your analysis and your topic, there are many ways to write up the results. I do believe however that certain elements should be present:
- A description of the objects to be sorted
- A description of the sorting task itself
- Do you use the single card sorting task or multiple card sorting task?
- Where participants required to use all the cards?
- What were the instructions?
- Did they have to label the piles?
- A description of the model used to analyze the data (i.e., this software)
- A description of model fit and the selection of number of summary piles
- Your analysis of the piles obtained
Points #1 and #2 should be relatively easy. Regarding point #3 (describing the model), I recommend using a paragraph such as the following:
To obtain insights into the piles produced by participants, we used the procedure proposed by Blanchard, Aloise and DeSarbo (2017) for the analysis of sorting task data.
From sorts by many individuals, the procedure produces a set of "summary piles" - piles that best describe a collection of heterogeneous sorts. In addition to helping with
summarizing the main piles individuals made, the procedure helps illustrate the differences between consumers in their sorts and which of many ways to sort were more prevalent.
Regarding model fit and summary pile selection, I would suggest the following (replacing the values you chose):
To identify the summary piles that best represent the sorts made by individuals, we followed the recommendations by Blanchard et al. (2017) via their software available at cardsorting.net.
Specifically, we sequentially executed the procedure 3 times for 300 seconds for each value of K=1...20 where K is the number of summary piles to be identified.
The results showed minimal effects of local optima, such that executions including more summary piles did not produce a significantly better fit.
Investigating the reduction of the number of mispredictions as we increase the number of summary piles, we followed the common approach of looking for an "elbow in the curve" via a scree plot.
That is, we looked for a model where the addition of more summary piles did not significantly improved model fit.We determined that the model with 11 summary piles, producing 421 mispredictions (96% accuracy), was appropriate.
The current citation for the paper is: Blanchard, Simon J., Daniel Aloise, Wayne S. DeSarbo. (2017) "Extracting Summary Piles from Sorting Task Data." Journal of Marketing Research, forthcoming.
Tips:

If you need help determining how do design the task, check out the following article (LINK)!